Capital efficiency of Indian unicorns
Analysing the valuations of Indian unicorns vs the amount of capital raised
This post was originally published here.
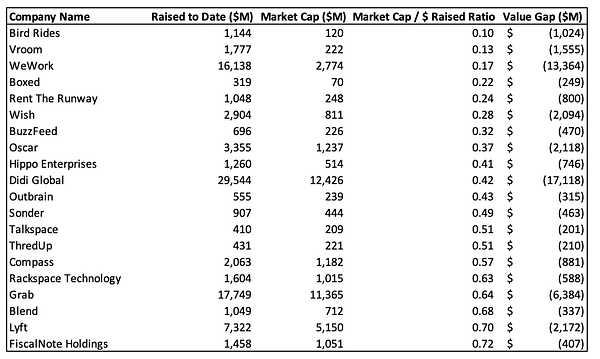
A few days back, Tanay shared this analysis of the market capitalisation of publicly listed startups in the US vs the equity capital raised. It’s a short but handy, back-of-the-envelope analysis to measure the value created by these startups for their investors. I recommend that everyone read this analysis.


This analysis got me curious about how Indian startups, especially Indian unicorns fare on this metric, given that we saw a flurry of unicorns, and IPO listings in 2021 followed by a VC winter that has bought us a long list of startups shedding workforce.
Valuation/$VC raised ratio
Following Tanay’s suite, I analysed the capital efficiency for Indian unicorns and found some interesting patterns emerging. Numbers offer us objectivity and provide a counterweight to storytelling. Post-money valuation/$VC raised serves as a simple metric to assess which companies, sectors, and business models have created the most value for investors and assess why is it so. I used data primarily from 2 sources: Tracxn and Entrackr. Here’s a link to the excel sheet with all the data.
Reasons for these patterns to emerge are the nature of revenues (recurring/high gross margins), the type of customers, or the moats built by the business. Simply put, margins → scale → value creation.
Predominantly B2C tech-enabled operations companies appear on the lower end of the spectrum — these startups have reached a massive scale by fulfilling existing customer needs with better execution, but due to their operational nature the avg rev/employee is low.
Another reason for tech-enabled ops companies to underperform is the lack of a global TAM or the lack of ease in scaling in global markets.
Startups with capital efficiency between 1-3X raised $21BN, created a market cap worth $46BN, but generate only ~$3.4BN in revenues, only a handful are close to profitability.
Middle of the pack has a healthy mix of pure-play digital and tech-enabled operations companies — consumer software companies, e-commerce, D2C, and logistics companies land up here.
Startups with capital efficiency between 3-10X raised $45BN, created a market cap worth $218BN, and generated $10BN in revenues.
Fintech, SaaS, Gaming, and vertical e-commerce companies are the top value creators → software-first companies come with a healthy mix of B2B and B2C-focused companies.
Fintech, SaaS, and Gaming companies at the higher end of the capital efficiency spectrum raised $2.9BN VC, created $48BN worth of market cap, and generated close to $3.4BN in revenues — these companies don’t need a lot of capital to achieve scale because of high margins.
Bootstrapped companies give higher capital efficiency to investors.
SaaS
Developers (and dev-tools) startups are the kings.
Value creation for SaaS is significantly higher due to recurring/predictable revenue, high gross margins, having businesses/developers as customers, and building a moat around their business, making it hard for customers to leave.
Fintech
Wealth management and credit startups will continue to thrive at the back of growing penetration in Tier - 2, 3.
Fintech SaaS is the most exciting segment — API platforms represent a large, global TAM in areas like compliance, digital identity, and core banking operations.
Ecommerce
Horizontal e-commerce companies predominantly lie in the middle of the pack with a few vertical commerce companies emerging as outliers because of profitability at scale and better user experience.
D2C
D2C roll-up startups might accrue greater value by acquiring smaller brands. Personal care, beauty, and food are the dominant categories in this sector.
D2C is a channel, not a brand, and most Indian D2C companies are omnichannel.
Edtech
Within Edtech, most companies are instructors supplemented by technology and not instructors supplemented by product. Only a few Edtech unicorns are truly product-first.
Consumer-tech
Real money (and skill-based) online gaming segments are growing fast in India.
Post-IPO
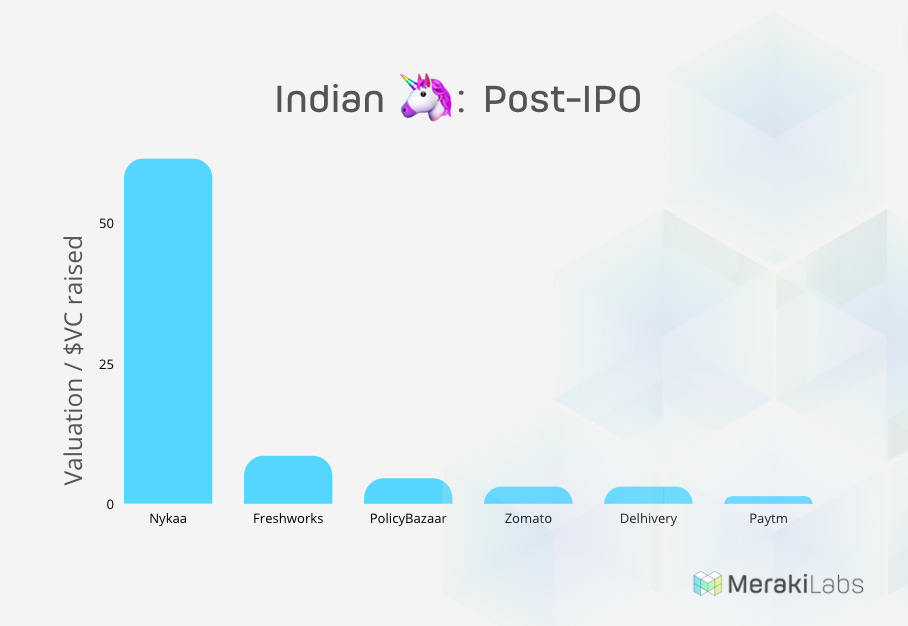
Public markets are the real testing ground for these startups and overpriced Indian startups are losing investors’ favour and have been floundering since their listing.
Many startups are rethinking about IPOs since public markets have punished the likes of Paytm, Zomato, PolicyBazaar, and Freshworks (listed in the USA). Nykaa and Delhivery are the only IPOs trading above the issue price.
Top valued startups
A large outcome isn’t necessarily a great outcome. Many companies such as Flipkart ($37.6BN), Swiggy ($10.1BN), Ola ($7BN), and Zomato ($6.5BN), just raised so much money along the way that they weren’t necessarily a great outcome for all the investors in aggregate.
B2B vs B2C
B2B startups are better value creators in aggregate. B2C startups are more capital intensive (high OpEx) and require constant funding (which will dilute equity or directly use up earned cash).
In conclusion
There are a few startups that lie high up the pecking order in capital efficiency. Zerodha and Nykaa have already proven profitability, and many investors are quite confident that Flipkart (and many others) can achieve similar results over time. However, these seem like exceptions more than the norm. Investors should focus on evaluating the potential long-term profitability of these businesses before they invest. If the public markets continue to slip, optimism will be replaced with scepticism, and the companies that are most dependent on proxies will be the ones that fall furthest.
It certainly seems like arbitrage is in full swing in terms of profitability. We are witnessing an increase in companies that file for IPOs with losses that are as large as (if not larger than) revenues. This means that expenses are over 2X that of revenues—economics that is worse than a company that sells dollars at a discount.


